Unraid UPS Monitoring with Prometheus and Grafana

Quick guide to help a couple of people from reddit on this post how to setup Grafana and Prometheus in Unraid, most of this is guide is based on the guide published on the unraid blog that you can check here.
Guide
1. Go to Community Apps (CA) and download the Grafana Docker container. Be sure to input your server's IP or hostname in the Key1 section when first setting up the container:
2. Download the Prometheus Docker container from CA. Note: The docker will be stopped after the installation and will be fixed in the next steps:
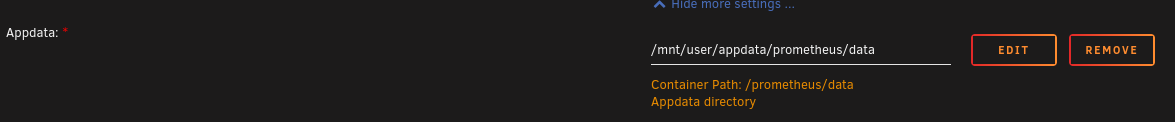
One thing i can recommend is changing the data path from the appdata to the array so that you don't have issues with the docker image filling up.
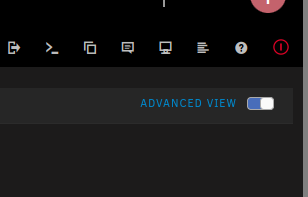
Another important thing is to add some extra stuff to the "Extra Arguments" and "Post Arguments" fields by pressing the "ADVANCED VIEW" button.
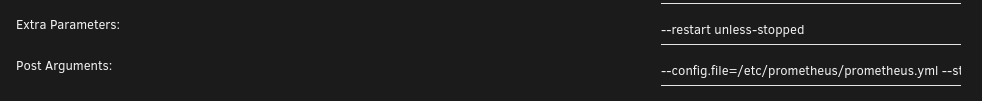
Now add --restart unless-stopped to the "Extra Parameters" field so that it auto restarts in case it crashes for some reason.
In the "Post Arguments" add --config.file=/etc/prometheus/prometheus.yml --storage.tsdb.path=/prometheus/data --storage.tsdb.retention.time=1y´, you can change the retention time for the metrics by changing the last option from "1y" to for example "30d" for 30 days retention time.
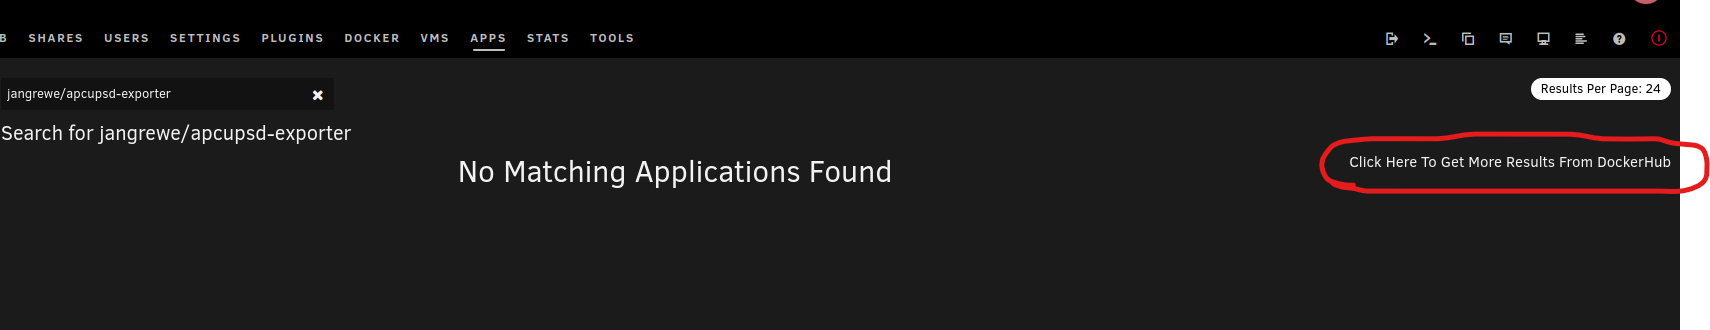
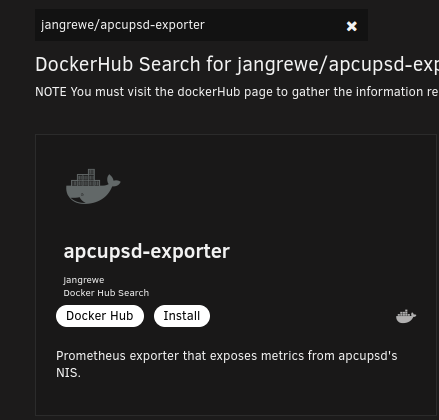
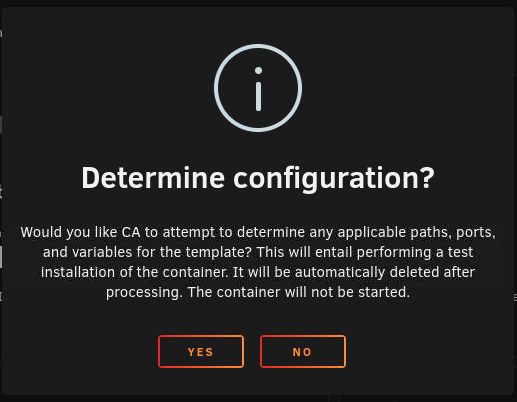
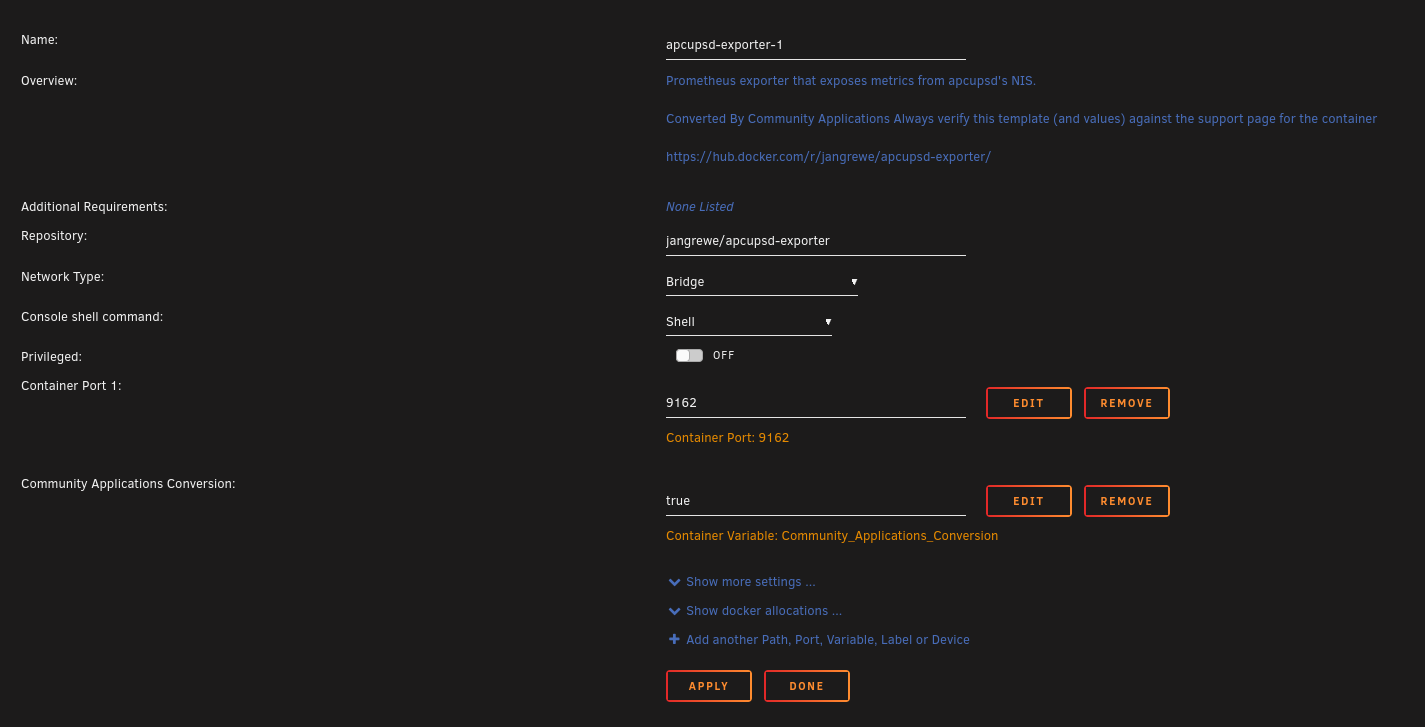
3. Download and install the apcupsd-exporter docker container from CA by searching for jangrewe/apcupsd-exporter and clicking on Click Here To Get More Results From DockerHub so that it shows results from dockerhub
Then press install and on the next dialog press Yes to allow CA to attempt to setup the template automatically.
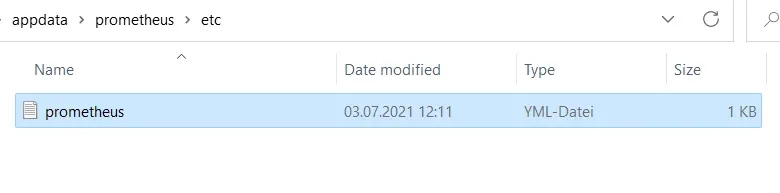
4. Download the 'prometheus.yml' and place it in your '.../appdata/prometheus/etc' directory on your Unraid server:
Note: You must be logged in to the Unraid forums to download.
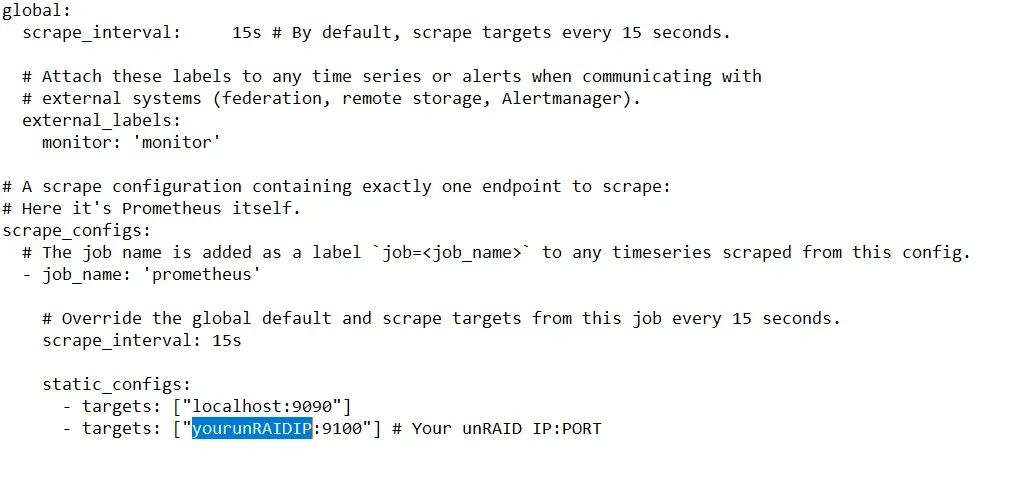
5. Open the prometheus.yml and edit the 'YOURUNRAIDSERVERIP' part so that it matches your server's IP and and change the 9100 port to the one you used in the apcupsd-exporter docker then save and close the file:
6. Go to your Docker page and start the Prometheus Docker container.
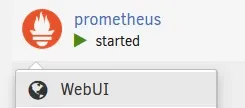
7. After it is started, click the Prometheus container again and select WebUI:
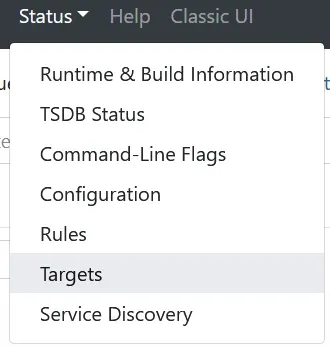
8. On the top click on "Status -> Targets":
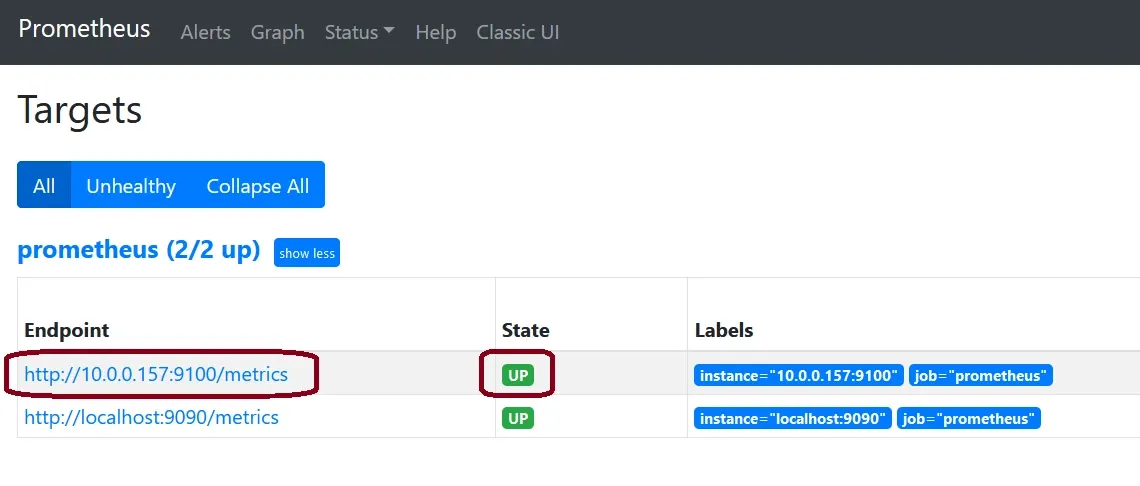
9. You should see now a list with two entries, the entry "YOURSERVERIP:PORT" should display "UP" like in the following screenshot:
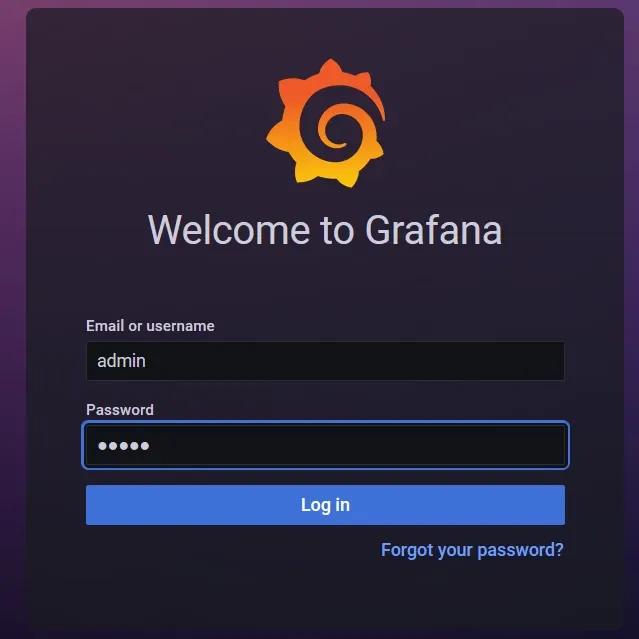
10. Go to the Docker page, start the Grafana WebUI and log in with your Username and Password (default: admin | admin):
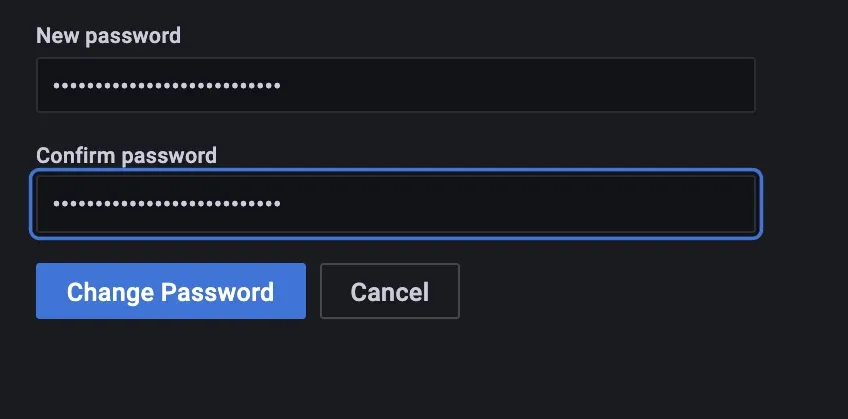
11. If you left it at default you should change the password in the next screen to something secure:
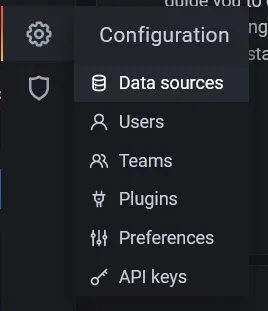
12. Next we are going to configure the Prometheus data source in Grafana by clicking on the "Gear Icon -> Data sources":
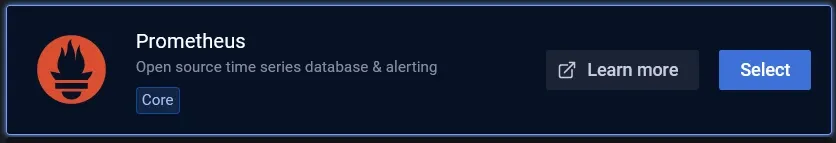
13. Click on "Add data source" and at Prometheus click on "Select":
In the "URL" field change the link to match the IP and PORT you used in the prometheus.yml.
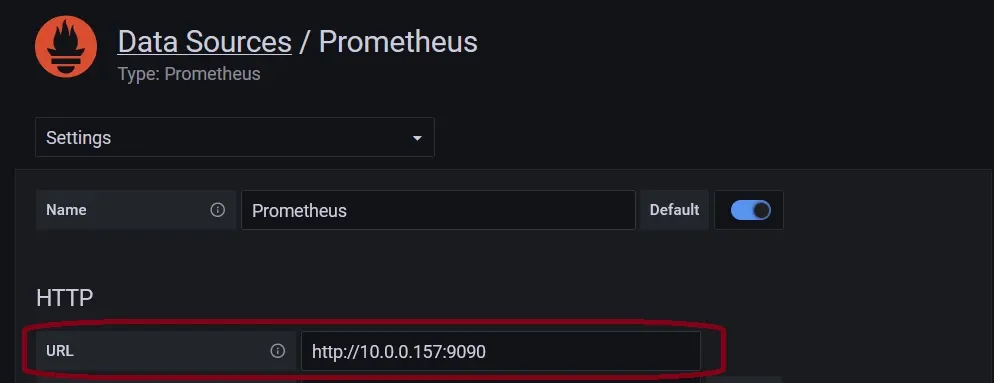
15. At the bottom click on "Save & Test" and you should see this message:
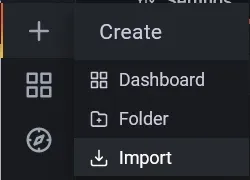
16. In Grafana click on "+ -> Import":
17. Now we are going to import a pre-configured Dashboard for the Node Exporter from Grafana.com (Source). To do this, simply enter the ID 19243 from the Dashboard and click "Load":
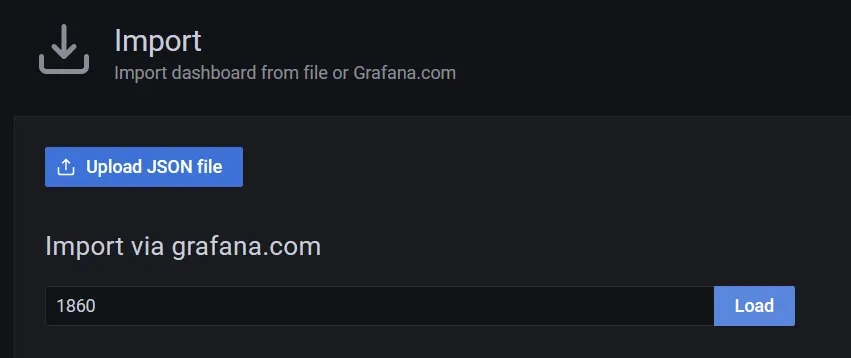
If the dashboard link is not working you can download this file and instead of using the dashboard ID upload the JSON file using the button above.
Based on a guide made by ich777 for the unraid blog so if you found this helpful...please consider donating to ich777 for this and all of his other hard work!
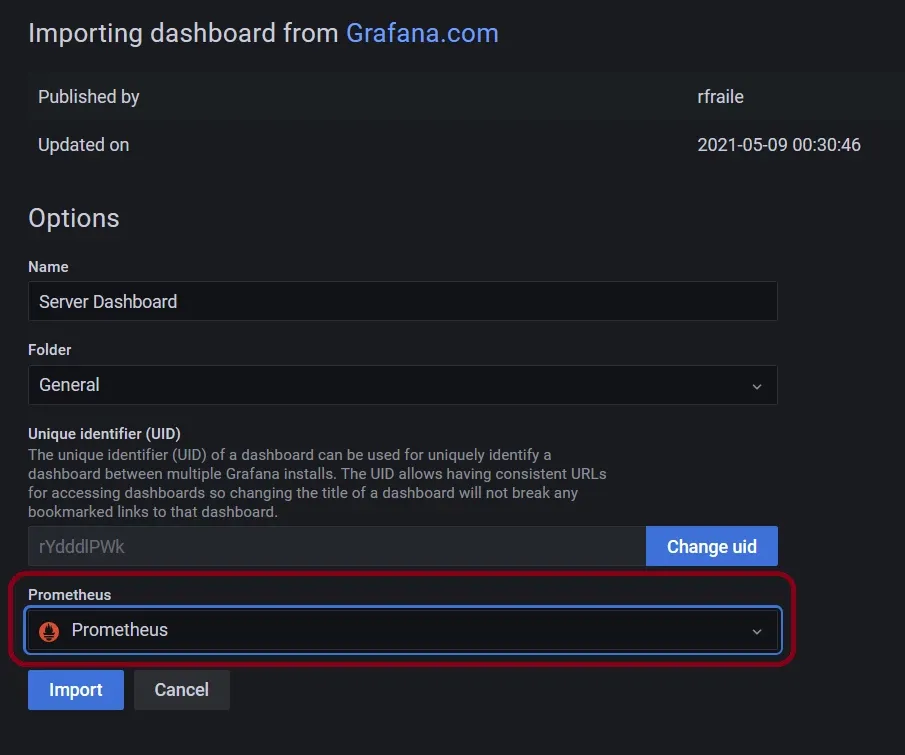
18. In the next screen be sure to select "Prometheus" as the data source and rename the Dashboard to your liking and click Import.
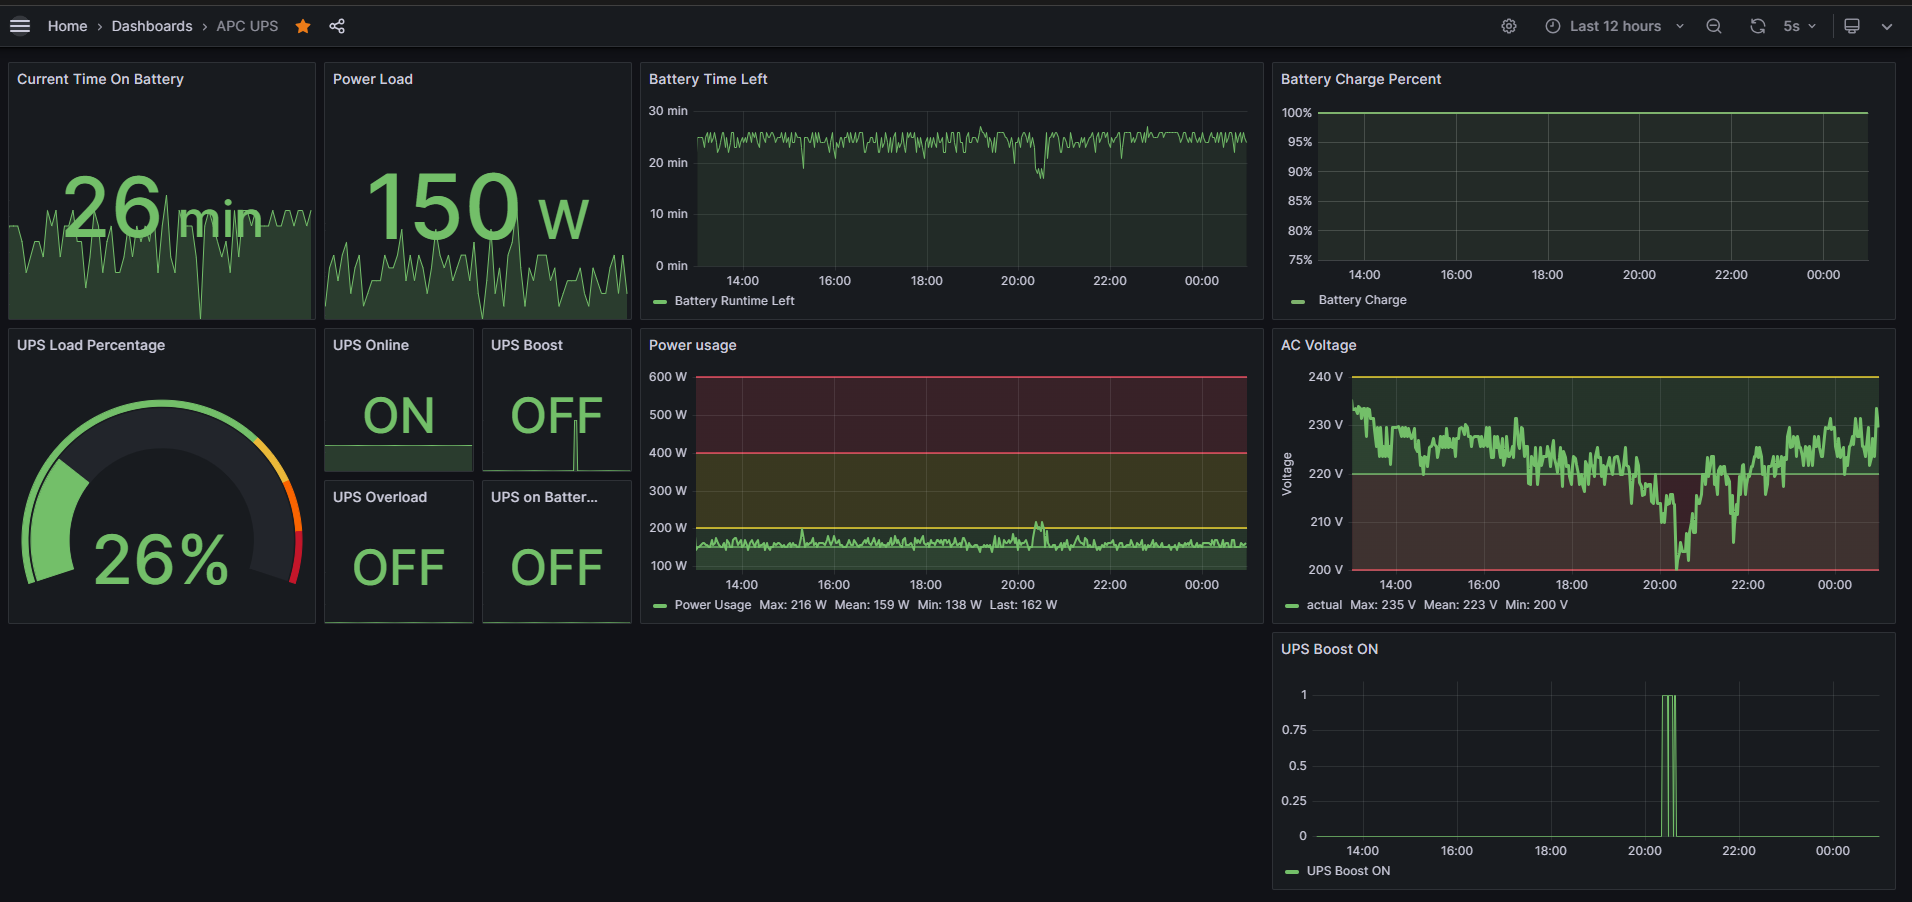
Now, you should be greeted with something like this:

Keep in mind that the Dashboard can display N/A values since there is not enough data available. Wait a few minutes and you will see that the values begin to fill in.
If you had any issues with this guide or found any error (likely to have some since this was made at work during the night shift and while i was really tired) you can contact me either by leaving a comment below or DM me in Discord, my username is toino.
Alternatively you can also reply to this reddit comment or DM me there.